FEATURED SCREENS
What shipped
010203040506
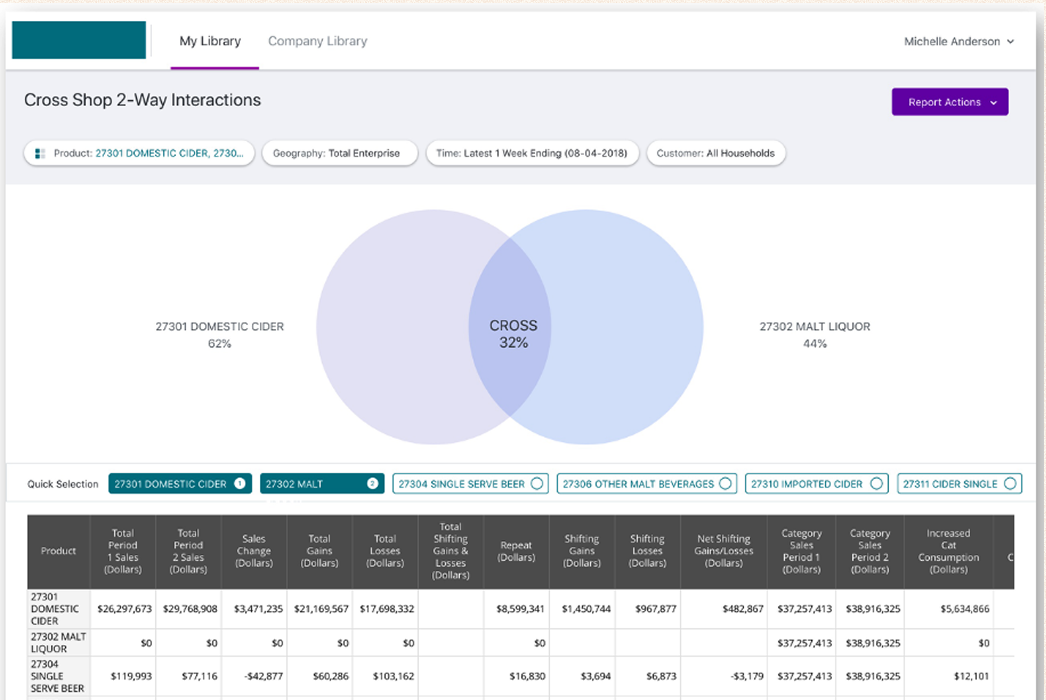
A grocery data analytics company needed to replace three slow, disconnected legacy tools with one platform, used by thousands of merchandisers, distributors, and analysts. I joined as an embedded ThoughtWorks consultant alongside my design manager, first fixing a stalled design process, then leading key design decisions that shaped a more usable product. The launch supported an existing base of 1,500 clients and $140M+ in annualized revenue, and NPS improved by 72 points.
84.51° is Kroger's data science arm, helping retailers and CPG companies turn grocery purchase data into insights about customers and market trends. The old tools were slow. Reports could take five minutes or longer to generate, and if you made a mistake, you started over from scratch. Worse, the three tools kept their data separate, so if you needed to see across sources, you were exporting everything into spreadsheets and building your own pivot tables by hand. And when a report type didn't exist in any of the three tools, people just built it themselves outside the system entirely.
Underneath all of that was a harder tension I kept coming back to throughout the project: balancing flexibility and sophistication against simplicity and speed. The tool needed to work for power users who wanted to build deeply custom views, and it needed to work just as well for someone who just needed a clean snapshot for a leadership meeting in ten minutes. Almost every design decision I made, especially around report layout, came back to holding both of those needs at once instead of picking one audience over the other.
the design bottleneck had to be solved first, or nothing else would have shipped
being in the same city as Kroger's merchandisers made frequent, in-person testing possible
A dynamic rows/columns structure reduced onboarding friction on every single report, which is what actually drove the NPS shift
replacing three tools' worth of inconsistent ones